

RSI (Relative Strength Index): How to Spot Reversals in Nifty Stocks
RSI (Relative Strength Index): How to Spot Reversals in Nifty Stocks
Ever wondered how traders spot stock reversals before they happen?
Thank you for reading this post, don't forget to subscribe!One powerful tool used by technical analysts is the Relative Strength Index (RSI). It helps identify whether a stock is overbought or oversold, giving clues about potential turning points — crucial information for making smart investment decisions.
In this blog, we’ll break down what RSI is, how to use it on Nifty 50 stocks, and how to avoid common traps to safeguard your investment.
What Is RSI?
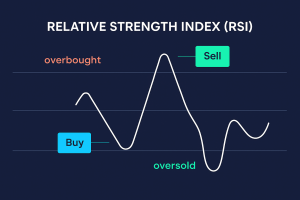
RSI (Relative Strength Index) is a momentum oscillator that measures the speed and change of price movements. It moves between 0 and 100.
🔍 Basic RSI Levels:
• Above 70 = Overbought (price may correct)
• Below 30 = Oversold (price may bounce) Developed by J. Welles Wilder, RSI is one of the most popular indicators for short-term traders and swing traders looking to optimize their investment timing.
RSI Formula (Simplified)
RSI = 100 – (100 / (1 + RS))
Where RS = Average gain over X periods / Average loss over X periods
(Default period is 14 days)
Luckily, you don’t have to calculate it manually—most trading platforms provide RSI on the chart by default.
How to Use RSI Strategy for Nifty Stock Reversals

✅ 1. Look for Overbought/Oversold Zones
• RSI > 70: Stock may be overheated. Consider booking profits or waiting for a dip to protect your investment.
• RSI < 30: Stock may be undervalued short term. A bounce could be near, potentially signaling a good investment entry point.
🔁 Use this with support/resistance zones for better accuracy.
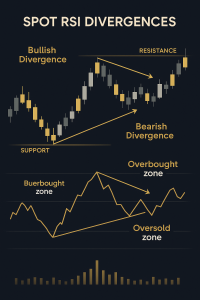
✅ 2. Spot RSI Divergences
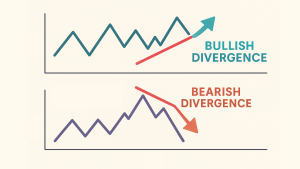
✴️ Bullish Divergence:
Price makes a lower low, but RSI makes a higher low
👉 Suggests weakness in selling—possible reversal up
✴️ Bearish Divergence:
Price makes a higher high, but RSI makes a lower high
👉 Suggests weakness in buying—possible reversal down
This is one of the most reliable reversal signals when used on liquid Nifty stocks like Reliance, Infosys, HDFC Bank, etc.
✅ 3. Use RSI with Price Action
- Combine RSI with candlestick patterns like hammer, engulfing, or doji at key levels
- Confirm RSI signals with volume analysis
📍 Example: If RSI shows oversold at a trendline support, and a bullish engulfing candle forms → strong reversal signal.
🧪 Real-World Example: RSI on a Nifty Stock
Let’s say you’re watching Infosys:
- RSI dips to 28
- Price approaches a key support level
- A bullish hammer candle forms on the daily chart
👉 This confluence gives a strong buy signal with a tight stop-loss, a smart move for any investment portfolio.
🚫 Common RSI Mistakes to Avoid
❌ Blindly Buying Below 30 or Selling Above 70
Sometimes a stock stays overbought or oversold for weeks—use confirmation before acting.
❌ Using RSI Alone
Always combine RSI with support/resistance, trend, and volume for high-probability trades.
❌ Ignoring Timeframe
RSI on a daily chart is more reliable for swing trades than on a 5-min chart.
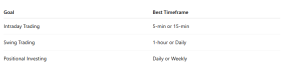
📅 Best Timeframes to Use RSI
Conclusion
RSI is a powerful reversal tool when used smartly. For Nifty stocks, it can help you:
• Avoid buying tops or selling bottoms and protect your investment
• Identify trend exhaustion early
• Time entries and exits more precisely
“Indicators don’t make decisions—you do. Use RSI as a tool, not a trigger.”
🚀 Want Help Timing Your Trades Better?
At Goodwill Wealth Management, we provide customized technical analysis reports and RSI-based trade setups on major Nifty stocks.
📞 Reach out to our research desk and sharpen your entry-exit timing like a pro.
Disclaimer: This blog post is intended for informational purposes only and should not be considered financial advice. The financial data presented is subject to change over time, and the securities mentioned are examples only and do not constitute investment recommendations. Always conduct thorough research and consult with a qualified financial advisor before making any investment decisions.