


Moving Averages (SMA vs EMA): Which One Works Best in Indian Markets?
Moving Averages (SMA vs EMA): Which One Works Best in Indian Markets?
Moving averages are the backbone of technical analysis. Whether you’re a trader or a long-term investment strategist, understanding how SMA (Simple Moving Average) and EMA (Exponential Moving Average) work can help you time your entries and exits more effectively.
Thank you for reading this post, don't forget to subscribe!But which one should you use—and when?
In this post, we’ll break down SMA vs EMA, their key differences, and which performs better in the context of Indian stocks and indices like Nifty, Bank Nifty, and top blue chips.
What Is a Moving Average?
A moving average smoothens price data by creating a constantly updated average price.
It helps filter out market noise and highlights the overall trend—an essential concept in technical analysis.
Common Uses:
- Identify trend direction
- Spot support/resistance levels
- Generate trade signals (crossover strategies)
- Validate entries with tools like RSI and volume
SMA vs EMA: The Basics

Both are widely used in technical analysis for making better-informed investment decisions.
Real-World Example: Nifty 50
Let’s say you apply a:
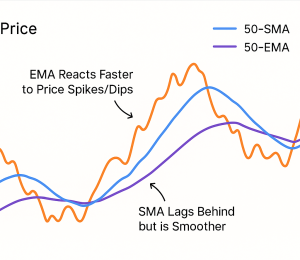
- 50-day SMA: Smooth but lags during fast moves
- 50-day EMA: Reacts quicker to volatility and short-term rallies/dips
👉 During volatile phases (like Budget announcements or RBI policy days), EMA gives faster signals.
Pair it with RSI to filter false signals and strengthen your trade conviction.
Which to Use When?
✅ Use SMA when:
- You’re a long-term investor
- You want stable trend signals
- You’re analyzing weekly/monthly charts (e.g., 200-day SMA on Infosys)
✅ Use EMA when:
- You’re a swing or intraday trader
- You need quick reactions to price changes
- You’re trading breakouts or reversals (e.g., 9-EMA crossover on Reliance)
EMA is especially useful for momentum-based investment decisions when paired with RSI and volume spikes.
Popular Moving Average Strategies
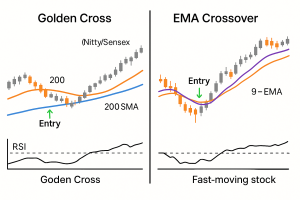
Golden Cross / Death Cross (SMA)
- 50 SMA crosses above 200 SMA → Bullish
- 50 SMA crosses below 200 SMA → Bearish
✅ Good for positional investment setups on Nifty and Sensex stocks.
Crossover Strategy (EMA)
- 9 EMA crosses above 21 EMA → Buy signal
- 9 EMA crosses below 21 EMA → Sell signal
✅ Works well for intraday/swing trades on high-volume stocks like HDFC Bank, ICICI Bank, and TCS.
Combine these with RSI to filter low-quality setups—a core rule in effective technical analysis.
Caution: Avoid These Mistakes
❌ Using too many moving averages
It clutters your chart and confuses your signals. Stick to core technical analysis setups.
❌ Blindly following crossovers
Always confirm with volume, RSI, or trendlines. Even the best investment signal fails if it’s not supported by context.
❌ Not adjusting for timeframes
A 20-EMA on a 15-min chart behaves very differently than on a daily chart—this matters whether you’re scalping or making long-term investment calls.
Pro Tip: Combine SMA and EMA
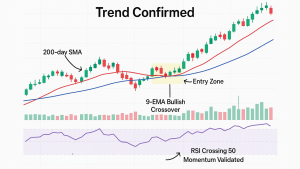
Use SMA for trend direction and EMA for precise entries.
Example:
- 200 SMA shows overall uptrend in Nifty
- 9 EMA crossover on daily chart signals a short-term entry
- RSI > 50 confirms upward momentum
👉 This gives you the best of both worlds—trend alignment with tactical execution.
Conclusion
Both SMA and EMA are powerful—but they serve different purposes. There’s no one-size-fits-all; it depends on your:
- Trading style (long-term vs short-term)
- Market conditions (volatile vs stable)
- Stock type (blue-chip vs midcap vs penny)
- Tools like volume and RSI to validate your decisions
“SMA shows the forest. EMA helps you spot the trees.”
Incorporating them properly into your technical analysis can dramatically improve your investment performance.
Related Blogs:
Stock Market Investment: Top 4 Equity Investment Tips for “Beginners”
RSI (Relative Strength Index): How to Spot Reversals in Nifty Stocks
MACD Explained with Indian Stocks: Catching Momentum Before It Peaks
Volume Analysis: How Smart Money Leaves Clues
Disclaimer: This blog post is intended for informational purposes only and should not be considered financial advice. The financial data presented is subject to change over time, and the securities mentioned are examples only and do not constitute investment recommendations. Always conduct thorough research and consult with a qualified financial advisor before making any investment decisions.