

Fibonacci Retracement: Do These Golden Ratios Hold?
Fibonacci Retracement: Do These Golden Ratios Hold?
Ever seen prices bounce off certain levels again and again—almost like magic?
Thank you for reading this post, don't forget to subscribe!That “magic” often comes from Fibonacci retracement levels. Derived from a mathematical sequence dating back centuries, these “golden ratios” are widely used in technical analysis to identify potential reversal points during pullbacks.
But do they actually work? Let’s break down the logic, the levels, and whether these ratios hold up in real-world markets—especially in volatile Indian investment environments like Nifty and Bank Nifty.
What Is Fibonacci Retracement?
Fibonacci Retracement is a classic technical analysis tool that maps out likely support and resistance zones. It applies mathematical ratios to a recent price move—typically from a major swing high to a swing low (or vice versa).
Key Fibonacci levels include:
- 23.6%
- 38.2%
- 50% (not a true Fibonacci number, but widely used)
- 61.8% (the Golden Ratio)
- 78.6%
These levels suggest where price might pause or reverse before continuing its original direction—giving investors and traders structured zones to watch.
Why Fibonacci Works (Psychologically)
Markets are driven by human behavior—and Fibonacci levels, just like other technical analysis tools, reflect natural proportions found in everything from pinecones to architecture.
In trading and investment, Fibonacci retracements help:
✅ Anticipate retracement zones
✅ Set logical stop-loss and entry points
✅ Improve risk-reward on trades
✅ Separate noise from high-probability trend continuation setups
✅ Combine with RSI or MACD for stronger confirmation
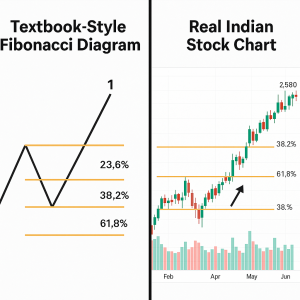
How to Plot Fibonacci Levels

- Identify a clear swing high and swing low
- Use a Fibonacci tool to draw from low to high (in an uptrend) or high to low (in a downtrend)
- Watch how price reacts around key levels: 38.2%, 50%, and especially 61.8%
💡 Pro Tip: Use longer time frames like daily or weekly for more reliable technical setups, especially for positional investments.
Example: Do These Ratios Hold in Indian Markets?
✅ Nifty 50 (Past Correction)
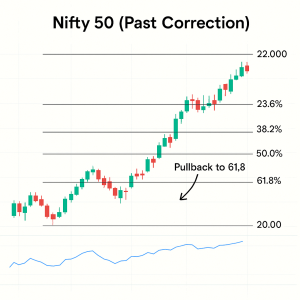
Rally from 19,000 to 22,000
→ Pullback to the 61.8% retracement (~20,840)
→ Reversal confirmed by rising volume and bullish RSI divergence
→ Nifty resumed trend — proving the power of golden ratio levels in technical analysis
✅ Reliance Industries
Post-breakout pullback found support near the 38.2% level
→ Price bounced with a bullish engulfing candle and strong RSI
→ Provided a quality investment re-entry for trend followers
Popular Fibonacci-Based Setups
1.Retracement Buy in Uptrend
- Pullback to 38.2% or 50%
- RSI > 40 or bullish candle confirms strength
- Strong risk-reward opportunity
📌 Used by investors in names like Infosys, HDFC Bank, and LTIMindtree
2.Breakout & Retest Trade
- Price breaks a key resistance
- Pulls back to 61.8% retracement
- Entry on bullish price action + volume spike
- Ideal during volatile phases in Bank Nifty
3.Confluence Setup
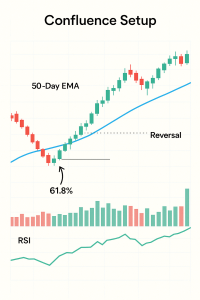
- Fibonacci level aligns with moving averages or trendlines
- Add-ons like RSI, MACD, or support zones increase conviction
- Strongest signals often lead to sustained investment-grade trend continuation
⚠️ Common Mistakes to Avoid
❌ Using Fibonacci in sideways or range-bound markets
❌ Relying on Fibonacci levels without RSI, price action, or volume confirmation
❌ Drawing retracements on small or irrelevant price swings
❌ Treating Fibonacci as a magic formula—it’s just one part of broader technical analysis
Does Fibonacci Work in Real Markets?
Yes—when used with context.
Fibonacci isn’t mystical—it works because many traders and investors watch these levels. That collective behavior leads to self-fulfilling outcomes.
Combine Fibonacci retracements with:
…and you’ll increase the probability of a successful investment or trade.
Conclusion
Fibonacci retracement isn’t a prediction tool—it’s a preparation tool. It gives you an edge by highlighting where markets might react.
Whether you’re looking for short-term trades or medium-term investment entries, it helps:
- Improve entry accuracy
- Set rational stop-losses
- Avoid emotional decisions during pullbacks
“Golden ratios don’t predict—they prepare.”
Related Blogs:
Stock Market Investment: Top 4 Equity Investment Tips for “Beginners”
RSI (Relative Strength Index): How to Spot Reversals in Nifty Stocks
MACD Explained with Indian Stocks: Catching Momentum Before It Peaks
Volume Analysis: How Smart Money Leaves Clues
Moving Averages (SMA vs EMA): Which One Works Best in Indian Markets?
Bollinger Bands: Volatility-Based Setups That Actually Work
Disclaimer: This blog post is intended for informational purposes only and should not be considered financial advice. The financial data presented is subject to change over time, and the securities mentioned are examples only and do not constitute investment recommendations. Always conduct thorough research and consult with a qualified financial advisor before making any investment decisions.
