

Top 5 Indicator Setups for Bank Nifty Traders in India
Top 5 Indicator Setups for Bank Nifty Traders in India
Bank Nifty—the heart of India’s financial sector—moves with speed, aggression, and precision. It’s known for its wild intraday swings, sharp reversals, and high-risk/high-reward opportunities.
Thank you for reading this post, don't forget to subscribe!Whether you’re a scalper hunting 30-point bursts or a swing trader holding overnight, you need reliable technical analysis setups tailored for Bank Nifty’s behavior.
This guide highlights 5 proven indicator combinations that smart traders use to time the index—accurately, consistently, and confidently.
Why Indicators Are Crucial in Bank Nifty
Bank Nifty is not a gentle mover. You need setups that:
Bank Nifty is not a gentle mover. You need setups that:
-
- 🕒 Time entries and exits with precision
- 🔁 Avoid sideways zones and false breakouts
- 💪 Confirm momentum and trend strength
- 🎯 Set tighter, logical stop losses
Top 5 Bank Nifty Indicator Setups That Actually Work
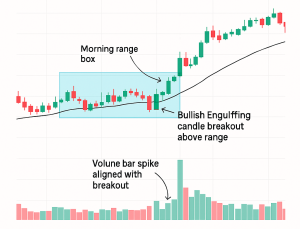
1️⃣ VWAP + Price Action + Volume (Intraday Setup)
Best for: 5-min / 15-min scalping
Setup:
- VWAP (Volume Weighted Average Price) guides trend bias
- Combine with bullish/bearish candlestick patterns (e.g., Inside Bar, Engulfing)
- Confirm breakouts with volume spikes
📌 Example:
Bank Nifty is trading above VWAP and breaks out of a morning range with rising volume → Go Long
🎯 Target: Minimum 1:2 Risk-Reward
🧪 Ideal for:
Morning breakouts, post-2PM volatility plays in intraday trading
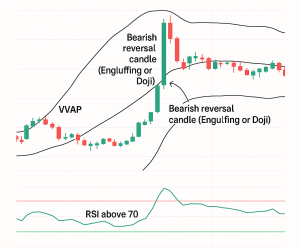
2️⃣ RSI + Bollinger Bands (Reversal Setup)
Best for: Catching intraday tops and bottoms
Setup:
- Use RSI (14) + Bollinger Bands (20,2)
- Look for RSI >70 or <30 while price touches outer bands
- Confirm with reversal candles (Doji, Hammer)
📌 Example:
RSI = 75 + Price hitting upper band + Bearish Engulfing = Short Signal
🎯 Trail stop loss as price reverts to mean (middle band)
🧪 Great for:
Counter-trend scalps, exit signals, and reversal hunting
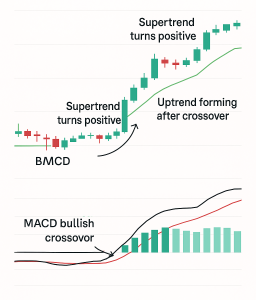
3️⃣ MACD + Supertrend (Swing & Intraday Trend Trades)
Best for: 30-min to daily chart setups
Setup:
- MACD crossover (12,26,9) gives early trend signal
- Supertrend (10,3) filters out noise
- Align trade with higher timeframe direction
📌 Example:
MACD bullish crossover + Supertrend turns green on 30-min chart → Buy Entry
🎯 Trail stop below Supertrend line
🧪 Best for:
Swing trades lasting 1–3 sessions, especially after news-based breakouts
4️⃣ CPR + EMA (Breakout Pre-Planning)
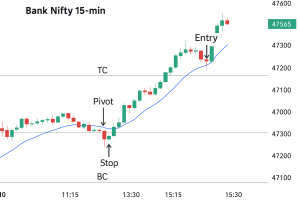
Best for: Pre-market planning and directional moves
Setup:
- Use Central Pivot Range (CPR) to define key S/R levels
- Add 20-EMA for dynamic trend following
- Breakouts from CPR + EMA support = powerful moves
📌 Example:
If Bank Nifty opens above CPR and finds support at 20-EMA → Long opportunity above Day High
🎯 Stop loss just below CPR
🧪 Best for:
Professional scalpers, F&O breakout traders, intraday planning
5️⃣ ADX + Stochastic Oscillator (Momentum Trades)
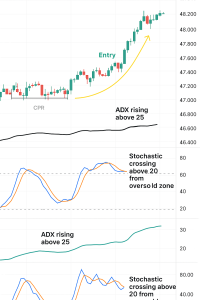
Best for: Trend explosions post-consolidation
Setup:
- ADX (14) > 20 = trending condition
- Stochastic (14,3,3) = short-term pullback entry
- Avoid trades when ADX < 15 (sideways)
📌 Example:
ADX rising > 25 + Stochastic bullish crossover near 20 → Entry Signal
🎯 Stop loss below swing low
🧪 Best for:
Catching momentum post-CPR compressions or flag patterns on hourly chart
⚠️ Common Mistakes Bank Nifty Traders Make
❌ Chasing breakouts without volume confirmation
❌ Ignoring trend on higher timeframes
❌ Trading during tight CPR days (sideways traps)
❌ Overusing indicators → confusion over clarity
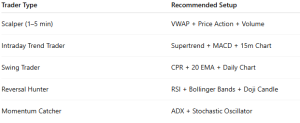
Customize Setups for Your Style
Conclusion
Bank Nifty trading is all about structure, timing, and risk control. These 5 setups provide a roadmap to navigate the chaos and lock into high-probability trades—whether you’re scalping, swinging, or hedging options.
“The goal isn’t to predict Bank Nifty—it’s to react faster, smarter, and more consistently than the rest.”
Related Blogs:
Stock Market Investment: Top 4 Equity Investment Tips for “Beginners”
RSI (Relative Strength Index): How to Spot Reversals in Nifty Stocks
MACD Explained with Indian Stocks: Catching Momentum Before It Peaks
Volume Analysis: How Smart Money Leaves Clues
Moving Averages (SMA vs EMA): Which One Works Best in Indian Markets?
Bollinger Bands: Volatility-Based Setups That Actually Work
Fibonacci Retracement in NSE: Do These Golden Ratios Hold?
ADX (Average Directional Index): How to Avoid Sideways Traps
Stochastic Oscillator vs RSI: Which One to Trust and When
Ichimoku Cloud: Can This Japanese Indicator Predict Indian Market Trends? – Goodwill’s Blog
Best Indicator Combinations for Swing Traders in India – Goodwill’s Blog
Disclaimer: This blog post is intended for informational purposes only and should not be considered financial advice. The financial data presented is subject to change over time, and the securities mentioned are examples only and do not constitute investment recommendations. Always conduct thorough research and consult with a qualified financial advisor before making any investment decisions.