

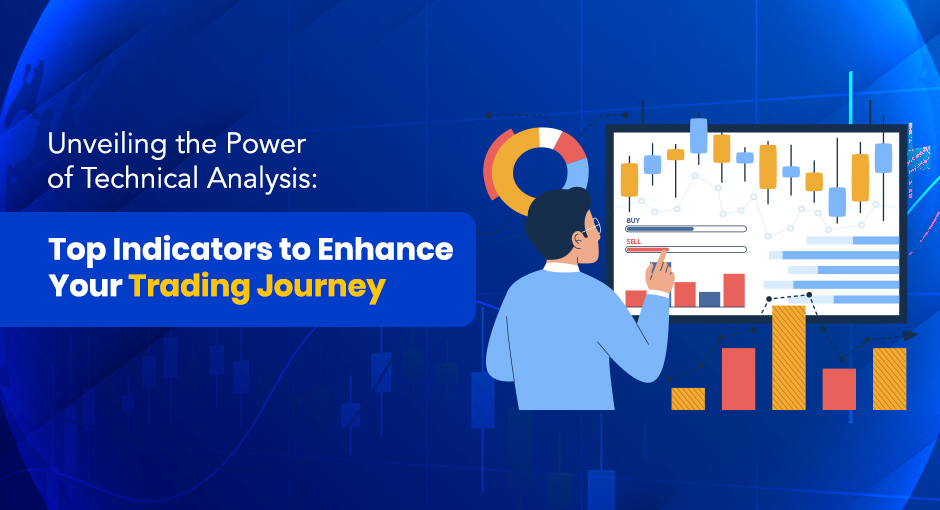
Unveiling the Power of Technical Analysis: Top Indicators to Enhance Your Trading Journey
Unveiling the Power of Technical Analysis
Every second counts in today’s fast paced, internet powered world. Having the right tools and knowledge could mean success as against failure in the financial market. Your ability to make proper analysis and deciding is going to be a key factor in your financial journey. In this blog we will learn about the different types of analyses. We will then dive deeper into the subject of Technical Analysis and how it can drastically change your approach to investment for the better. Whether you’re a beginner or a veteran, understanding the fundamentals along with the key indicators will be instrumental as you navigate through the complexities of the financial world.
Thank you for reading this post, don't forget to subscribe!Types of Analyses
There are primarily two types of Analyses, namely Fundamental Analysis and Technical Analysis. Fundamental analysis is nothing but studying a company’s financial health. Learning about the company’s revenue, earnings, assets and liabilities helps determine the company’s intrinsic value and potential for growth. This type of analysis focuses on qualitative and quantitative factors such as the effectiveness of the management, industry trends and economic conditions for investment decisions.
The other important type is Technical Analysis. In the forthcoming sections, we will look at technical analysis in depth and understand the nuances of it.
What is Technical Analysis?
Technical analysis is used by investors to evaluate and forecast price movements of financial instruments such as stocks, currencies, commodities and indices. In contrast to fundamental analysis, which focuses on a company’s financial health and intrinsic value, technical analysis predominantly focuses on studying past market data, primarily price and volume. This aids in identifying trends, patterns and potential trading opportunities. Analysts use various tools like chart patterns, indicators and oscillators to analyse past data and make predictions about future price movements, allowing investors to find market trends, momentum and resistance levels, which in-turn is useful for making informed decisions in the financial market.
There are several indicators available to traders to make important decisions. In the forthcoming section, we shall study a few of them and how they can help us in succeeding.
Top Indicators of Technical Analysis
There are quite a few indicators for technical analysis. Each indicator differs in terms of the value it provides and the trustworthiness of it. In this section, we shall look at some of the most common indicators and learn the effectiveness of them to improve our trading performance.
1. Moving Averages: Moving averages is the primary technical analysis indicator/tool that smooths out price data and helps identify trends over a specified period of time. There are two major types of moving averages; Simple Moving Averages (SMA) and Exponential Moving Averages (EMA). Traders can compare different moving averages or use them in conjunction with each other to make sound financial decisions and filter out the noise from the market data.
2. Relative Strength Index (RSI): The RSI is a momentum oscillator used in technical analysis to measure the speed and change in price movements of a stock/security. It ranges from 0 – 100 and is typically displayed in the form of a line graph. Typically when RSI is over 70, it indicates that the security is overbought which can indicate that it is due for a correction. And conversely, when the RSI is less than 30, it can indicate that the security is oversold and is again due for a correction. Traders use RSI to identify positive and negative signals in the market to benefit from market price changes.
3. Moving Average Convergence Divergence (MACD): The Moving Average Convergence Divergence (MACD) is an important and versatile momentum oscillator that helps identify changes in strength, direction, momentum and duration of a trend. MACD has 3 major components; the MACD line, the signal line and the histogram. The MACD line is plotted in the MACD chart by subtracting the 26-period Exponential Moving Average (EMA) from the 12-period EMA and it represents the difference between the two EMAs. (Usually period is indicated in days)
The signal line is represented by the 9-period EMA of the MACD line and is also known as the trigger line. It indicates buy/sell opportunities as it crosses above/below the MACD line.
The histogram represents the difference between the MACD line and the signal line.
MACD helps traders identify Bullish and Bearish trends, ie., when the MACD line crosses above the signal line, it generally indicates a bullish signal, indicating a positive trend. Conversely, when the MACD line crosses below the signal line, it indicates a bearish signal, showing a negative trend. MACD is also used for trend identification and momentum analysis.
4. Bollinger Bands: Bollinger Bands consist of a simple moving average (SMA) and two standard deviations plotted both positively and negatively from the SMA. They deviate and contract based on Market Volatility. This provides traders with a visual representation of price volatility and enables them to make better market decisions that will allow for better profitability.
There are other indicators that help traders with making important decisions in the financial market. By leveraging the above indicators, traders can improve their trading performance and manage risks more effectively. It is important to note that all Technical Analysis Indicators should be used in conjunction with each other to make decisions as using multiple indicators together increases confirmation and reduces false signals, enhancing overall accuracy in trading decisions.
Choose Goodwill Wealth Management:
Goodwill Wealth Management – One of the best share Broker in India offers extensive courses on Technical and Fundamental Analyses. We dedicate our time to making sure that all of our clients understand the intricacies of the financial market and achieve success in the long run. We conduct regular seminars, webinars and workshops that are not only detail oriented but we conduct them in the clients’ native languages across India to ensure that language is not a barrier for portfolio management. Join Goodwill Wealth Management’s team and open free trading and demat account today!
Conclusion
In conclusion, technical analysis is a useful tool that traders can employ to identify patterns, trends, and potential trading opportunities in the market. By understanding technical analysis concepts and incorporating key indicators into your trading strategy, you can improve your chances of success and accomplish your financial goals. Remember to do your Trading and Demat account opening and choose a reliable broker, such as Goodwill Wealth Management to obtain the tools and resources needed for success in the financial market.