

ADX (Average Directional Index): How to Avoid Sideways Traps
ADX (Average Directional Index): How to Avoid Sideways Traps
Ever entered a trade expecting a breakout—only to watch the price go absolutely nowhere?
Thank you for reading this post, don't forget to subscribe!That’s the sideways trap—a trader’s worst enemy. In these non-trending zones, stop-losses get triggered, capital erodes, and emotions spiral. But there’s one technical analysis tool that helps filter out this market noise: the Average Directional Index (ADX).
Let’s break down what ADX is, how it works, and how to use it to lock into strong trends—and avoid low-probability investment zones in Indian stocks and indices.
What Is ADX?
The Average Directional Index (ADX), introduced by J. Welles Wilder, is a trend strength indicator. Unlike RSI or MACD, ADX doesn’t tell you whether the trend is bullish or bearish—it simply tells you how strong the trend is.
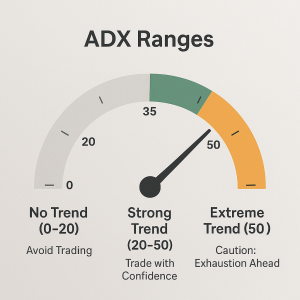
It ranges from 0 to 100:
- Below 20 → Weak or no trend (avoid trades or fresh investments)
- 20–25 → Potential trend development
- 25–50 → Strong, tradable trend
- Above 50 → Rare, extended trend (often nearing exhaustion)
In technical analysis, this makes ADX an essential filter to separate healthy trends from sideways traps.
Components of the ADX System
- ADX Line → Measures trend strength
- +DI (Positive Directional Indicator) → Strength of upward price movement
- –DI (Negative Directional Indicator) → Strength of downward price movement
Key Signal Logic:
- +DI > –DI → Bullish bias
- –DI > +DI → Bearish bias
- ADX rising above 25 → Trend is gaining momentum
When used correctly, ADX transforms your technical analysis into a precision tool for trend validation.
How ADX Helps Avoid Sideways Traps
Sideways markets are littered with false breakouts and fake momentum. ADX acts like a filter that clears the fog.
✅ ADX < 20–25 → Stay out. High chance of getting chopped.
✅ Wait for ADX to rise above 25 before entering trend trades
✅ Combine ADX with RSI, volume, or moving averages for stronger confirmation
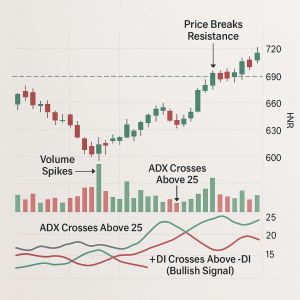
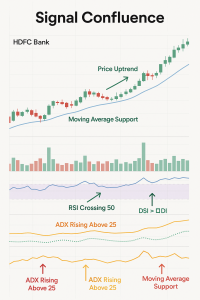
Real Example: Nifty 50
During consolidation phases (like pre-budget weeks), ADX typically hovers below 20. Breakouts in such periods often fail, trapping investment positions and intraday traders alike.
But when ADX rises above 25 and +DI leads, breakouts from that same range often follow through—especially when backed by volume and RSI strength.
📈 Lesson: ADX helps smart traders stay patient until the trend confirms—avoiding emotional trades in flat zones.
ADX Strategy: Simple but Powerful
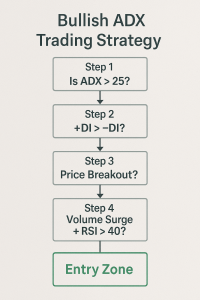
✅ Setup: Trend Confirmation Strategy
- Use 14-period ADX
- Wait for ADX to cross 25
- Check +DI vs –DI to identify trend direction
- Enter only when price action, ADX, and volume confirm trend strength
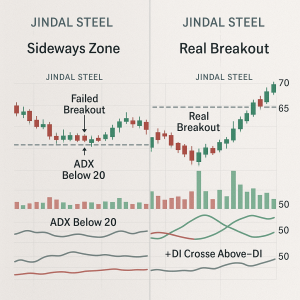
Example Setup:
- Stock: Tata Motors
- ADX: Climbs from 18 to 28
- +DI crosses above –DI
- Volume surge and breakout from base
→ High-probability long trade and attractive short-term investment opportunity
🧠 Pro Tips to Maximize ADX Utility
🔹 Pair ADX with RSI (over 40 = bullish trend setup)
🔹 Use ADX in technical screeners to find trending stocks
🔹 Avoid lower timeframes like 5-min—stick to 1-hour, daily, or weekly for positional investment-grade trends
❌ Common Mistakes to Avoid
❌ Trading with ADX below 20
→ High risk of noise and sideways action
❌ Ignoring DI crossovers
→ You lose directional context
❌ Expecting ADX to give entries/exits
→ It tells you when to be involved—not how. Use price action, volume, or RSI for entries
Does ADX Work in Real Markets?
✅ Absolutely—especially when combined with other technical analysis tools.
Many successful traders and investors use ADX as a pre-filter:
- No trend = no trade
- Strong trend = play with conviction
It works best when aligned with:
- RSI readings
- Trendlines or moving averages
- Support/resistance zones
- Volume and momentum shifts
By doing so, you remove low-quality setups and focus only on high-probability investment decisions.
Conclusion
ADX is your trend strength radar. It doesn’t tell you the direction—but it tells you when not to waste your time or capital. And that’s half the game.
“Sideways markets are silent killers. ADX is your early warning system.”
Focus your trades and investments on clean, trending opportunities. Stay out of choppy zones. Let ADX, RSI, and structure guide you—not noise.
Related Blogs:
Stock Market Investment: Top 4 Equity Investment Tips for “Beginners”
RSI (Relative Strength Index): How to Spot Reversals in Nifty Stocks
MACD Explained with Indian Stocks: Catching Momentum Before It Peaks
Volume Analysis: How Smart Money Leaves Clues
Moving Averages (SMA vs EMA): Which One Works Best in Indian Markets?
Bollinger Bands: Volatility-Based Setups That Actually Work
Fibonacci Retracement in NSE: Do These Golden Ratios Hold?
Disclaimer: This blog post is intended for informational purposes only and should not be considered financial advice. The financial data presented is subject to change over time, and the securities mentioned are examples only and do not constitute investment recommendations. Always conduct thorough research and consult with a qualified financial advisor before making any investment decisions.