


Best Indicator Combinations for Swing Traders in India
Best Indicator Combinations for Swing Traders in India
Swing trading is the sweet spot between high-speed day trading and long-term investing. By holding trades for a few days to weeks, traders aim to profit from short- to medium-term price swings.
Thank you for reading this post, don't forget to subscribe!But here’s the truth: No single technical analysis tool is foolproof. Success in the Indian stock market hinges on using smart indicator combinations that complement each other—improving timing, accuracy, and confidence.
Let’s break down the top 5 indicator combos for Indian swing traders—built on logic, not hype.
What Makes a Good Indicator Combo?
An ideal investment strategy for swing trading includes:
✅ Trend Identification – Understand where the market is heading
✅ Momentum Detection – Gauge strength of the move
✅ Entry/Exit Triggers – Time your trades precisely
✅ Volume Confirmation – Follow smart money footprints
Top 5 Indicator Combinations That Work in India
1️⃣ Moving Average + RSI + Volume
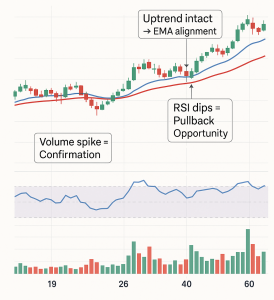
🔹 Trend + Momentum + Confirmation
- Moving Averages (20/50 EMA): Detect the trend
- RSI (14): Catch overbought/oversold zones or divergence
- Volume: Confirms breakout or breakdown moves
📌 Strategy:
- Trade only in the direction of the MA trend
- Wait for RSI to dip below 40 in an uptrend (buy zone)
- Confirm with above-average volume on breakout
🧪 Best for: Swing breakout setups in Nifty stocks and F&O counters
2️⃣ MACD + Bollinger Bands
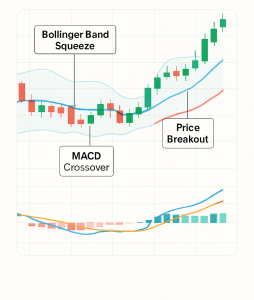
🔹 Trend Shift + Volatility Expansion
- MACD: Identifies trend shifts and momentum crossovers
- Bollinger Bands: Spot consolidation and breakout zones
📌 Strategy:
- Look for MACD crossover (bullish/bearish)
- Confirm with price breaking out of a narrow Bollinger range
🧪 Best for: Midcap swings and post-consolidation breakouts in the Indian stock market
3️⃣ Ichimoku Cloud + Stochastic Oscillator
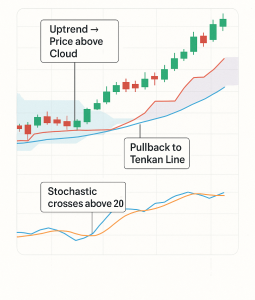
🔹 Trend Structure + Entry Timing
- Ichimoku Cloud: Visualize trend, support, and resistance
- Stochastic (14,3,3): Pinpoint short-term pullbacks
📌 Strategy:
- Trade only when price is above the cloud and Tenkan > Kijun
- Enter on Stochastic cross above 20
- Exit when Stochastic hits overbought (80+)
🧪 Best for: Trend continuation setups in trending sectors like Auto, Banks
4️⃣ ADX + RSI Divergence
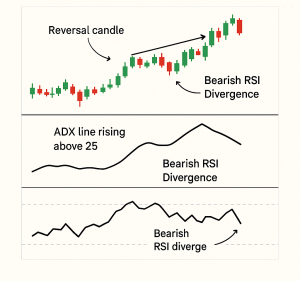
🔹 Trend Strength + Early Reversal Signals
- ADX (Above 20): Confirms a strong trend
- RSI Divergence: Spots potential reversals early
📌 Strategy:
- Wait for ADX to rise above 25
- Look for bullish or bearish divergence on RSI
- Align with ADX direction for high-probability entries
🧪 Best for: Catching early trend reversals in stocks like Infosys, HDFC, TCS
5️⃣ Fibonacci Retracement + Candlestick Patterns + Volume
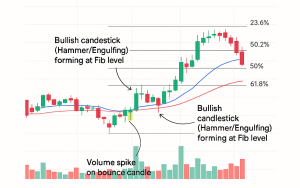
🔹 Smart Pullback Entries
- Fibonacci Levels (38.2%, 50%, 61.8%): Key retracement zones
- Bullish Candles (Hammer, Engulfing): Entry confirmation
- Volume: Validates the strength of the bounce
📌 Strategy:
- Draw Fib from recent swing low to high
- Enter near 50% or 61.8% on bullish candle + volume spike
🧪 Best for: Catching low-risk pullbacks in trending stocks (like Reliance, Titan, Asian Paints)
❌ Combinations That Don’t Work Well
- RSI + Stochastic: Both show momentum → redundant
- Too Many Indicators: Creates noise and conflicting signals
- MACD on 5-min chart: Too lagging for fast intraday trades
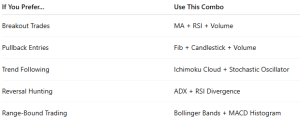
How to Pick the Right Combo for Your Style
Conclusion
The best swing traders in the Indian stock market don’t rely on just one tool—they create systems using confluence-based technical analysis. When trend, momentum, and volume align, your probability of success increases exponentially.
“Indicators don’t predict—they react. But used together, they offer precision and clarity in your investment strategy.”
Related Blogs:
Stock Market Investment: Top 4 Equity Investment Tips for “Beginners”
RSI (Relative Strength Index): How to Spot Reversals in Nifty Stocks
MACD Explained with Indian Stocks: Catching Momentum Before It Peaks
Volume Analysis: How Smart Money Leaves Clues
Moving Averages (SMA vs EMA): Which One Works Best in Indian Markets?
Bollinger Bands: Volatility-Based Setups That Actually Work
Fibonacci Retracement in NSE: Do These Golden Ratios Hold?
ADX (Average Directional Index): How to Avoid Sideways Traps
Stochastic Oscillator vs RSI: Which One to Trust and When
Ichimoku Cloud: Can This Japanese Indicator Predict Indian Market Trends? – Goodwill’s Blog
Disclaimer: This blog post is intended for informational purposes only and should not be considered financial advice. The financial data presented is subject to change over time, and the securities mentioned are examples only and do not constitute investment recommendations. Always conduct thorough research and consult with a qualified financial advisor before making any investment decisions.