

Bollinger Bands: Volatility-Based Setups That Actually Work
Bollinger Bands: Volatility-Based Setups That Actually Work
Markets don’t move in straight lines—they expand and contract based on volatility. That’s exactly what Bollinger Bands capture.
Thank you for reading this post, don't forget to subscribe!Created by John Bollinger, this powerful technical analysis indicator helps you identify overbought/oversold conditions, trend reversals, and breakout opportunities—all based on price volatility.
Let’s explore how Bollinger Bands work, how to use them smartly, and the most reliable setups for Indian stocks and investment decisions.
What Are Bollinger Bands?
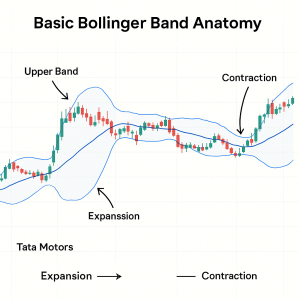
Bollinger Bands consist of three lines:
- Middle Band = 20-day Simple Moving Average (SMA)
- Upper Band = 20 SMA + (2 × Standard Deviation)
- Lower Band = 20 SMA – (2 × Standard Deviation)
The bands expand when volatility is high and contract when it’s low. This forms the foundation for many high-probability technical analysis setups used in both trading and short-term investment strategies.
What Bollinger Bands Tell You
✅ Overbought:
Price touches or crosses the upper band → Potential selling point (confirm with RSI)
✅ Oversold:
Price touches or dips below the lower band → Potential buying zone for value investments
✅ Squeeze:
Bands narrow significantly → Volatility compression before a breakout
👉 Especially useful for anticipating big moves in stocks like SBI or Bajaj Finance during earnings
✅ Expansion:
Bands widen rapidly → Confirmed breakout or trend continuation
Combine with volume and RSI to avoid false breakouts
3 Proven Bollinger Band Setups
The Bollinger Band Squeeze
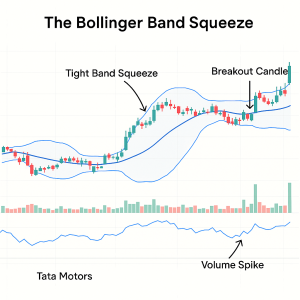
- Bands contract tightly → low volatility
- Breakout in either direction follows
- Combine with volume surge or RSI confirmation
🔎 Works great on stocks like Tata Motors or Adani Ports before earnings or news-driven events.
Perfect for short-term investment entry setups based on volatility compression.
Double Bottom with Band Break
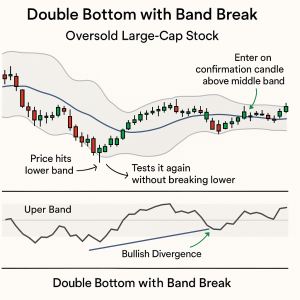
- Price hits lower band → rebounds → tests it again without breaking lower
- RSI shows bullish divergence
- Enter on confirmation candle above middle band
📌 Ideal for investment-style reversal plays in oversold large caps like Infosys or HDFC Life.
Used in classic technical analysis to time low-risk long entries.
Trending Band Ride
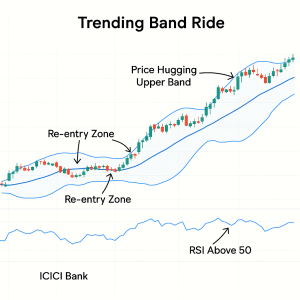
- Price hugs the upper band in an uptrend (or lower band in a downtrend)
- Avoid countertrend trades
- Use pullbacks to middle band as re-entry points
✅ Useful for riding momentum in trending stocks like L&T, ICICI Bank, or Nifty50 futures.
Pair with RSI to confirm sustained strength and improve timing for swing investments.
⚠️ Common Mistakes to Avoid
❌ Thinking Bands = Support/Resistance
They’re dynamic zones based on volatility, not fixed price levels. Use them alongside technical analysis indicators like trendlines and Fibonacci levels.
❌ Blindly Buying/Selling Band Touches
Always use confirmation tools like RSI, MACD, or candlestick formations.
❌ Ignoring Market Context
Bollinger Bands behave differently in sideways vs trending markets—crucial for active investment strategies.
Pro Tip: Combine With RSI or Volume
Use RSI to confirm overbought/oversold zones
Use Volume spikes to validate breakout strength
Example:
Breakout above upper band
- RSI > 60
- High volume
= Strong long setup for technical traders and aggressive short-term investors
Case Study: Bollinger Band Squeeze in Nifty
- Early February: Bands narrow sharply
- Breakout above upper band with volume surge
- Nifty rallies over 500 points in 10 days
🎯 Lesson: Volatility squeeze + RSI + breakout = High-probability technical analysis trade
Conclusion
Bollinger Bands aren’t magic—but when used with price action, RSI, and volume, they give you powerful volatility-based setups for both short-term trading and tactical investment decisions.
Whether you’re swing trading mid-caps or analyzing breakouts in Bank Nifty, Bollinger Bands can sharpen your technical analysis edge.
“When the bands squeeze, the pros get ready to strike.”
Related Blogs:
Stock Market Investment: Top 4 Equity Investment Tips for “Beginners”
RSI (Relative Strength Index): How to Spot Reversals in Nifty Stocks
MACD Explained with Indian Stocks: Catching Momentum Before It Peaks
Volume Analysis: How Smart Money Leaves Clues
Moving Averages (SMA vs EMA): Which One Works Best in Indian Markets?
Disclaimer: This blog post is intended for informational purposes only and should not be considered financial advice. The financial data presented is subject to change over time, and the securities mentioned are examples only and do not constitute investment recommendations. Always conduct thorough research and consult with a qualified financial advisor before making any investment decisions.