

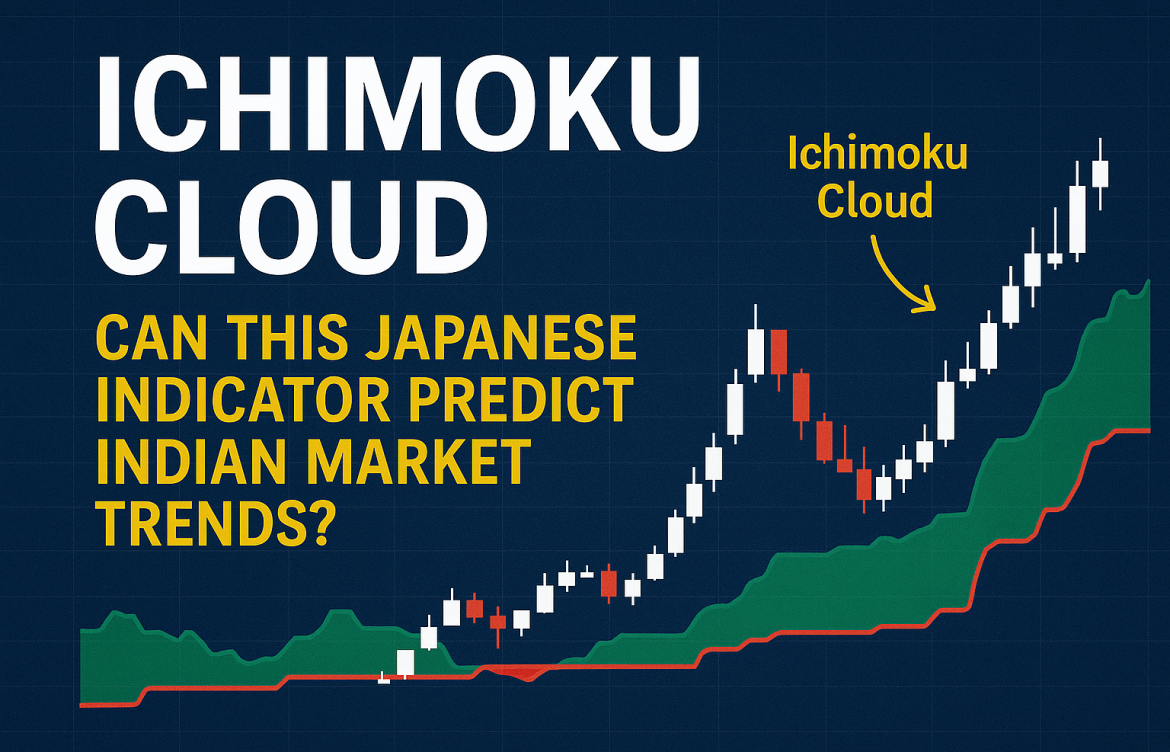
Ichimoku Cloud: Can This Japanese Indicator Predict Indian Market Trends?
Ichimoku Cloud: Can This Japanese Indicator Predict Indian Market Trends?
While most traders focus on common tools like RSI, moving averages, or MACD, there’s a lesser-known gem in the world of technical analysis—the Ichimoku Cloud. Designed in Japan, this indicator visualizes trend, support, resistance, and momentum in one single chart.
Thank you for reading this post, don't forget to subscribe!But here’s the question:
Can the Ichimoku Cloud work in the Indian stock market—on indices like Nifty or Bank Nifty, or on stocks like Reliance and HDFC?
✅ The answer is yes—if you know how to read it correctly.
Let’s decode how the Ichimoku Cloud works and how you can use it to spot high-probability investment opportunities in the Indian markets.
What Is the Ichimoku Cloud?
Developed by Goichi Hosoda, Ichimoku Kinko Hyo translates to “one glance equilibrium chart.” And that’s exactly what it offers—a complete market picture in one glance.
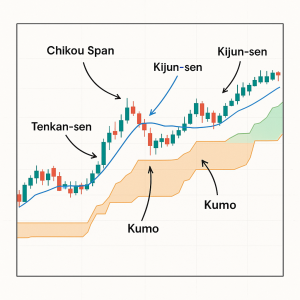
It comprises five key components:
- Tenkan-sen (Conversion Line): Short-term trend (9-period average)
- Kijun-sen (Base Line): Medium-term trend (26-period average)
- Chikou Span (Lagging Line): Price plotted 26 periods back
- Senkou Span A & B: Projected 26 periods ahead—these form the Kumo (Cloud)
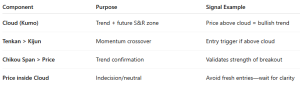
The Cloud is the soul of this system, representing future support, resistance, and trend strength—all built into one visual.
How to Read the Ichimoku Cloud
Real Example: Nifty 50
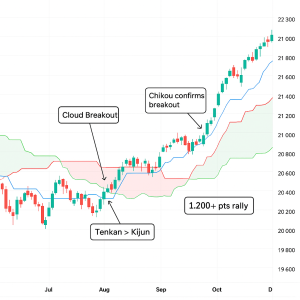
In July 2023, Nifty 50 broke above the cloud.
- Tenkan > Kijun
- Chikou Span above price
- Rising Kumo ahead
📈 Result? A 1,200+ point rally followed over the next few weeks.
This is why Ichimoku is a respected tool in both trend-following and breakout technical analysis strategies.
How to Trade the Ichimoku in Indian Markets
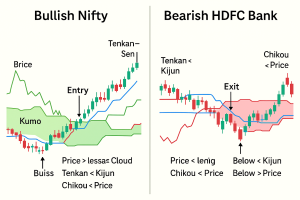
✅ Bullish Setup
- Price above the cloud
- Tenkan-sen crosses above Kijun-sen
- Chikou Span above price
- Kumo sloping upward
👉 Perfect for breakout or trend-following trades
✅ Bearish Setup
- Price below the cloud
- Tenkan-sen crosses below Kijun-sen
- Chikou Span below price
- Cloud sloping downward
👉 Ideal for short trades or safe exit from long investment positions
Why the Ichimoku Cloud Stands Out
✅ Forward-Looking: Unlike most lagging tools in technical analysis, Ichimoku projects 26 periods into the future
✅ One-Glance Clarity: Quickly identifies trend strength, reversals, and entry zones
✅ Great for Daily & Weekly Charts: Ideal for positional trades in Indian indices and F&O stocks
Pro Tips for Indian Traders
🔹 Use Ichimoku on higher timeframes (Daily > 1H > 15m)
🔹 Add volume or RSI divergence for stronger conviction
🔹 Wait for the cloud breakout—not just Tenkan/Kijun crosses
⚠️ Common Mistakes to Avoid
❌ Trading crosses below the cloud—false signals are common
❌ Ignoring the thickness or slope of the Kumo
❌ Applying to illiquid stocks—Ichimoku Cloud works best with volume-backed names in the Indian stock market
Conclusion
The Ichimoku Cloud is more than just another indicator—it’s a complete technical system that simplifies the market’s complexity. Once mastered, it can sharpen your entries, exits, and investment decisions—especially in trending Indian markets like Nifty, Bank Nifty, and top F&O counters.
“In a market full of noise, Ichimoku offers structured clarity—if you understand its language.”
Related Blogs:
Stock Market Investment: Top 4 Equity Investment Tips for “Beginners”
RSI (Relative Strength Index): How to Spot Reversals in Nifty Stocks
MACD Explained with Indian Stocks: Catching Momentum Before It Peaks
Volume Analysis: How Smart Money Leaves Clues
Moving Averages (SMA vs EMA): Which One Works Best in Indian Markets?
Bollinger Bands: Volatility-Based Setups That Actually Work
Fibonacci Retracement in NSE: Do These Golden Ratios Hold?
ADX (Average Directional Index): How to Avoid Sideways Traps
Stochastic Oscillator vs RSI: Which One to Trust and When
Disclaimer: This blog post is intended for informational purposes only and should not be considered financial advice. The financial data presented is subject to change over time, and the securities mentioned are examples only and do not constitute investment recommendations. Always conduct thorough research and consult with a qualified financial advisor before making any investment decisions.