

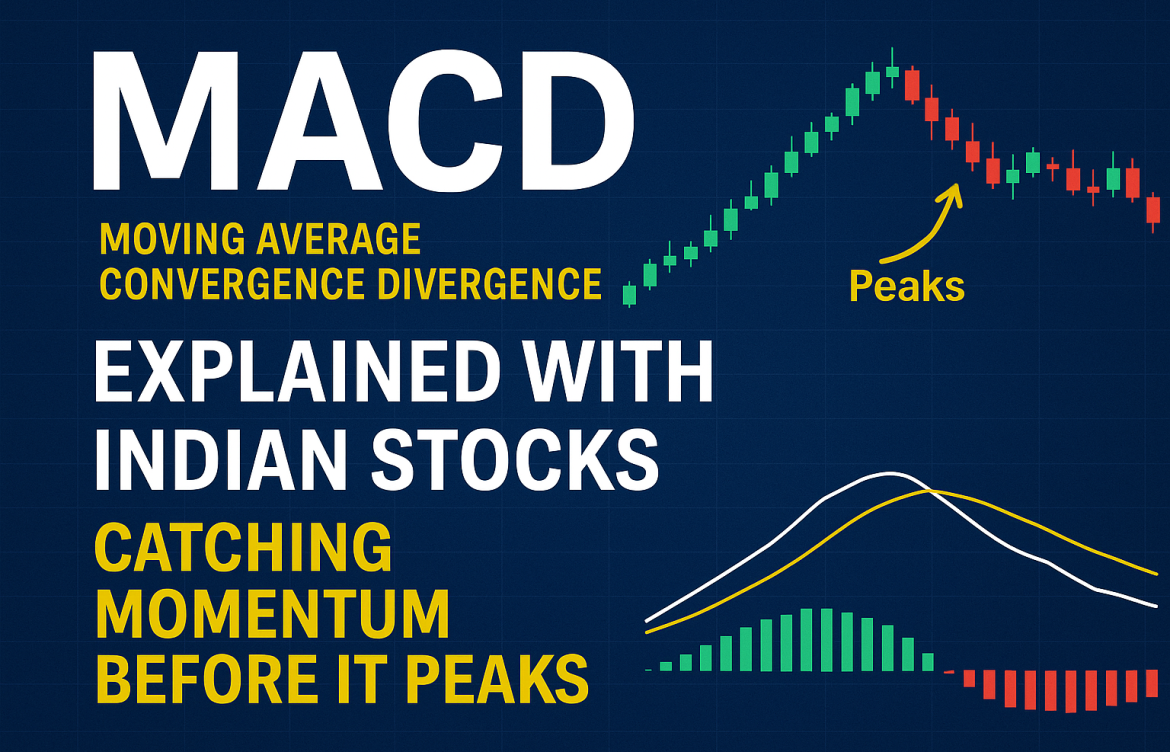
MACD Explained with Indian Stocks: Catching Momentum Before It Peaks
MACD Explained with Indian Stocks: Catching Momentum Before It Peaks
Every trader wants to catch a trend early—before the big move happens. One tool that helps spot these momentum shifts is the MACD (Moving Average Convergence Divergence).
Thank you for reading this post, don't forget to subscribe!MACD is a trend-following momentum indicator that signals potential entries and exits. It’s especially useful for Indian stocks like Reliance, TCS, Infosys, HDFC Bank, and other Nifty 50 names.
If you’re serious about investment timing and maximizing returns, MACD—along with tools like RSI (Relative Strength Index)—can be extremely valuable.
In this post, we’ll decode MACD, show you how to read its signals, and explain how to use it effectively with real-world Indian stock examples.
What Is MACD?
MACD tracks the relationship between two exponential moving averages (EMAs) of a stock’s price.
It consists of three components:
- MACD Line = 12-day EMA – 26-day EMA
- Signal Line = 9-day EMA of the MACD Line
- MACD Histogram = Difference between the MACD Line and Signal Line
The MACD oscillates above and below zero, identifying bullish and bearish momentum—helpful for swing traders and investment professionals alike.
How to Read MACD Signals

✅ 1. MACD Line Crosses Above Signal Line → Bullish Signal
This suggests the stock’s upward momentum is increasing.
📈 Example:
If Infosys’ MACD line crosses above the signal line on the daily chart → Potential entry point for an investment strategy.
✅ 2. MACD Line Crosses Below Signal Line → Bearish Signal
Indicates downward momentum or a reversal from a previous uptrend.
📉 Example:
If HDFC Bank shows this crossover after a rally, it may signal trend exhaustion—a potential exit or defensive investment move.
✅ 3. MACD Crossover Near the Zero Line = Strong Signal
- Bullish crossover above zero → Often the start of a new uptrend
- Bearish crossover below zero → Often the start of a new downtrend
These are stronger signals that can align well with RSI readings to refine your investment decisions.
Bonus: MACD Divergence
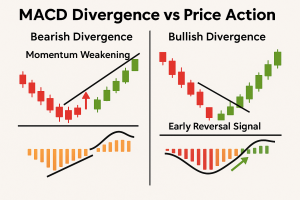
✴️ Bullish Divergence:
Price makes a lower low, but MACD makes a higher low
👉 Early sign of upward reversal—especially powerful when RSI also shows oversold conditions.
✴️ Bearish Divergence:
Price makes a higher high, but MACD makes a lower high
👉 Watch for a pullback—a signal that momentum is weakening and your investment needs re-evaluation.
Many traders pair MACD divergence with RSI divergence for even more reliable signals.
Best Timeframes for MACD
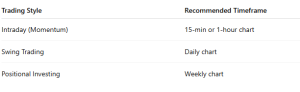
💡 Note: MACD works best in trending markets, not in sideways consolidations. Pair it with tools like RSI for higher confidence in your investment outlook.
How to Use MACD with Indian Stocks
✅ Step 1: Apply MACD on your charting platform (e.g., TradingView, Zerodha Kite, etc.)
✅ Step 2: Spot a bullish or bearish crossover — ideally near the zero line or after consolidation
✅ Step 3: Confirm the signal with RSI, price action, volume, or key support/resistance zones.
Real-World Example: MACD on Reliance Industries
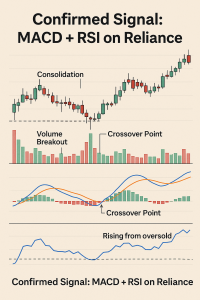
- MACD crossover above the signal line on the daily chart
- Occurs after a 2-week consolidation
- Breakout with rising volume and RSI showing strength
👉 Entry signal confirmed — perfect for a swing trade or short-term investment.
🚫 Common MACD Mistakes to Avoid
❌ Chasing Every Crossover
Not all signals are valid—always confirm with RSI, price action, and volume.
❌ Using MACD in Sideways Markets
Gives false signals in range-bound stocks.
❌ Ignoring Trend Direction
MACD is more effective when used in the direction of the prevailing trend—just like RSI.
Conclusion
MACD is a powerful tool to catch momentum shifts early, especially when used with other indicators like RSI. For Indian stocks, it helps you:
- Spot trend continuation or reversals
- Time entries and exits with confidence
- Strengthen your technical investment strategy
- Avoid emotional, guess-based trades
“Momentum precedes price. MACD helps you see that momentum shift before others do.”
Related Blogs:
Stock Market Investment: Top 4 Equity Investment Tips for “Beginners”
RSI (Relative Strength Index): How to Spot Reversals in Nifty Stocks
Disclaimer: This blog post is intended for informational purposes only and should not be considered financial advice. The financial data presented is subject to change over time, and the securities mentioned are examples only and do not constitute investment recommendations. Always conduct thorough research and consult with a qualified financial advisor before making any investment decisions.
