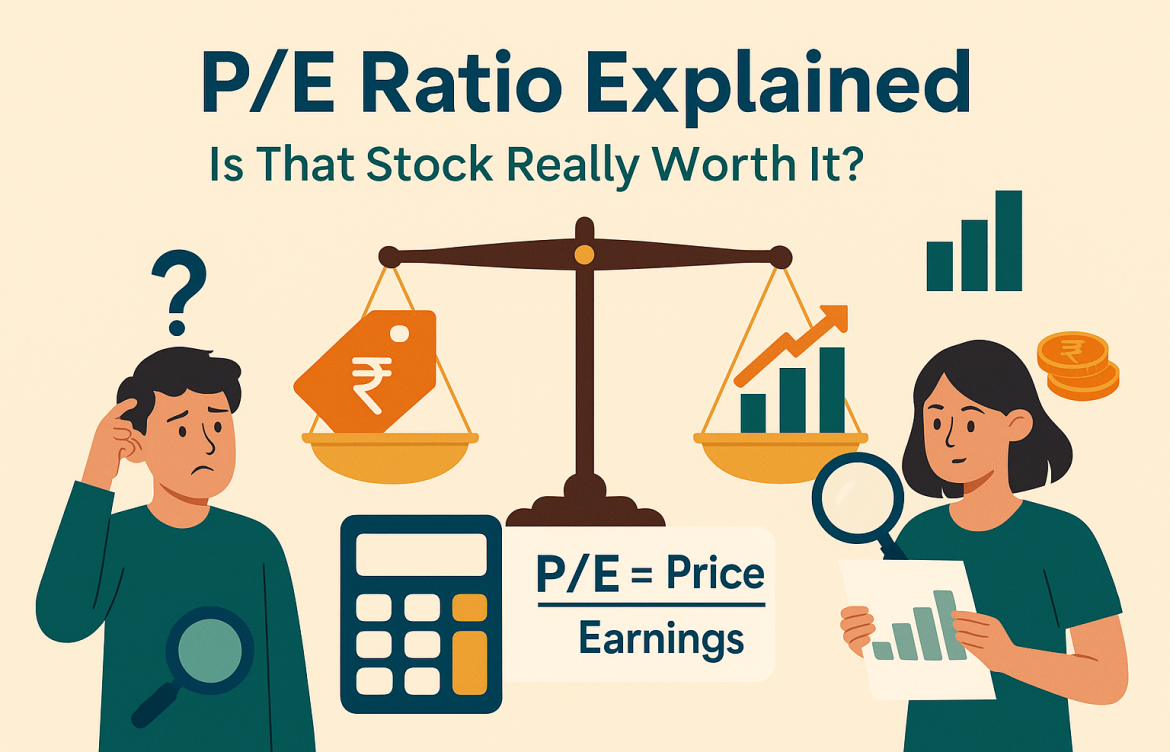
P/E Ratio Explained: Is That Stock Really Worth It?
P/E Ratio Explained: Is That Stock Really Worth It?
Investing in the stock market can feel like decoding a complex puzzle. Among the many tools investors use, one stands out for its simplicity and power — the P/E ratio. But what does it really tell you? And is a high or low P/E good or bad?
Thank you for reading this post, don't forget to subscribe!Let’s break it down so you’ll never look at stock valuations the same way again.
What is the P/E Ratio?
The Price-to-Earnings (P/E) Ratio is one of the most widely used metrics in investing. It shows how much investors are willing to pay for ₹1 of a company’s earnings.
📊 P/E Ratio = Price per Share ÷ Earnings per Share (EPS)
If a company’s stock is trading at ₹100 and its EPS is ₹10, the P/E ratio is:
100 ÷ 10 = 10
This means investors are willing to pay ₹10 for every ₹1 of the company’s earnings.
Why Does the P/E Ratio Matter?
The P/E ratio helps answer one fundamental question:
👉 “Is this stock overpriced, underpriced, or fairly valued?”
A high P/E could mean the stock is expensive relative to earnings — or that investors expect big growth ahead.
A low P/E could mean the stock is undervalued — or that the company is struggling.
So it’s not just about the number — it’s about what that number reflects.
Types of P/E Ratios
- Trailing P/E
Based on the last 12 months’ earnings. Most commonly used. - Forward P/E
Based on projected earnings. Useful for growth companies. - Sector-relative P/E
Compare a company’s P/E to others in the same industry. This gives better context.
Interpreting the P/E Ratio: High or Low — Which is Better?
Let’s decode what different P/E ranges might indicate (especially in the Indian market):
| P/E Range | Meaning | Example |
| 0 – 10 | Possibly undervalued or under stress | PSU banks, turnaround plays |
| 10 – 20 | Fair valuation (Indian average ~21) | Mid-sized stable companies |
| 20 – 40 | Growth expectations priced in | FMCG, tech, consumer brands |
| 40+ | Very high optimism, riskier bets | New-age tech, startups |
📌 Note: In India, Nifty 50 historically trades at a P/E between 18–24.
Real-Life Example: HUL vs ITC (As of 2024)
- Hindustan Unilever (HUL): P/E ≈ 58
- ITC: P/E ≈ 24
HUL is priced richly because of its brand power and growth potential. ITC, while profitable, trades at a lower P/E because of market skepticism about its long-term direction.
Does that mean HUL is overvalued? Not necessarily. It depends on future earnings growth.
When the P/E Ratio Misleads
While useful, P/E ratio is not perfect. Here’s when it can be misleading:
🚫 Company has no earnings (loss-making) — P/E becomes meaningless
🚫 One-time gains or losses can skew EPS
🚫 Ignores debt levels and cash flow health
🚫 Doesn’t reflect sectoral differences
💡 Always use it with other metrics like PEG Ratio, Price-to-Book, and ROE.
P/E Ratio by Sector in India (FY24 Averages)
| Sector | Average P/E |
| FMCG | 45–60 |
| IT Services | 22–28 |
| Pharma | 30–40 |
| Banking – Private | 12–18 |
| Banking – PSU | 6–10 |
| Auto | 18–25 |
| Metals | 5–10 |
Source: NSE & GWC India Research
This shows why comparing a bank’s P/E to a tech company’s is apples-to-oranges.
How to Use the P/E Ratio in Your Investing
Here’s a simple 3-step strategy:
- Compare the company’s P/E to:
- Its own past
- Sector average
- Broader market (e.g., Nifty 50 P/E)
- Ask why the P/E is high or low.
- Growth? Risk? Market perception?
- Use it with other indicators.
- Combine with earnings growth (PEG), ROE, and balance sheet strength.
Golden Tip: PEG Ratio = P/E ÷ Earnings Growth Rate
A PEG below 1 = undervalued for its growth.
A PEG above 1 = potentially overpriced.It’s a great tool when evaluating high P/E stocks like consumer tech or FMCG.
Conclusion: Is That Stock Really Worth It?
The P/E ratio is a window into what the market thinks a company is worth — but it’s not the whole house.
Use it as a guide, not a gospel. The real value lies in understanding the story behind the number.
And if you’re just starting out, platforms like GWC India can help you screen and invest in fundamentally strong companies — P/E and all.

