

Volume Analysis: How Smart Money Leaves Clues
Volume Analysis: How Smart Money Leaves Clues
Prices can lie—but volume rarely does.
Thank you for reading this post, don't forget to subscribe!While most retail investors focus only on price charts, seasoned traders and investment professionals pay close attention to volume—because that’s where smart money (big institutional players) leaves its footprint.
Volume analysis is a powerful tool in technical analysis that helps confirm breakouts, detect false moves, and understand when a trend has real strength behind it.
Let’s decode how to use volume like a pro and track what the big players are up to in Indian stocks.
What Is Volume?
Volume refers to the number of shares traded during a specific time period.
- High volume = high interest and possible investment activity
- Low volume = lack of conviction
Volume reveals how many market participants are involved in a move—crucial for validating trends or reversals in technical analysis.
Why Volume Matters
✅ Confirms Breakouts
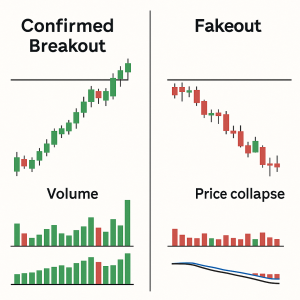
- A price breakout above resistance on strong volume = likely to sustain
- A breakout on low volume = may be a trap or false move
✅ Detects Smart Money Accumulation
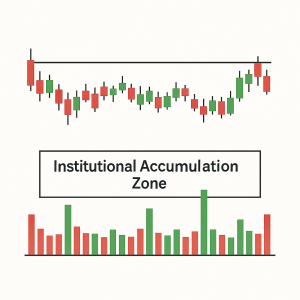
Big institutions don’t buy all at once.
Unusual volume spikes with little price change often signal accumulation or distribution—a key clue in investment timing.
✅ Reveals Reversals
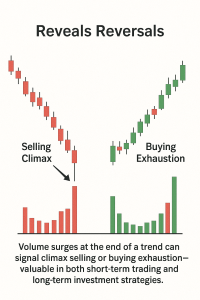
Volume surges at the end of a trend can signal climax selling or buying exhaustion—valuable in both short-term trading and long-term investment strategies.
Key Volume Patterns to Watch
- High Volume + Price Rise
👉 Bullish strength. Buyers are active.
📍 Example: A rally in Infosys with volume 2x average = Smart money interest and potential investment zone.
- High Volume + Price Fall
👉 Bearish pressure. Selling is backed by conviction—important for exit decisions in your investment portfolio.
- Breakout on High Volume
👉 Strong confirmation of a new trend—ideal in technical analysis for both swing traders and long-term investors.
- Breakout on Low Volume
👉 Possible fakeout. Wait for volume to confirm before committing capital.
Real-Life Example: Volume Clues in HDFC Bank
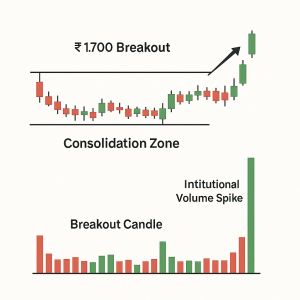
HDFC Bank consolidates in a narrow range for weeks.
Suddenly breaks out above ₹1,700 with volume 3x the average.
📈 The stock continues rising over the next few sessions.
📌 Lesson: Volume confirmed that the breakout had institutional support—a great example of how technical analysis tools can enhance your investment decision-making.
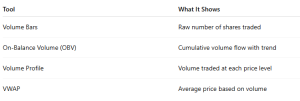
Tools for Volume Analysis
🚫 Common Volume Analysis Mistakes
❌ Ignoring Volume Spikes in Sideways Markets
These could be accumulation zones—early signs of big moves.
❌ Acting on Price Without Volume Confirmation
Avoid trades where volume doesn’t support the price move—especially important in long-term investment plans.
❌Only Watching Volume During the Day
Use daily or weekly volume for stronger signals. Intraday volume can be noisy and misleading in technical analysis.
Pro Tip: Volume Precedes Price
Often, smart money enters before a big move becomes obvious.
If you see:
- Low volatility
- Sudden volume surge
- Break from range
👉 You may be looking at a pre-breakout accumulation, a goldmine for early investment entry.
Conclusion
Volume is one of the most underrated indicators in technical analysis—but it’s also one of the most powerful.
By mastering volume analysis, you can:
• Spot where big players are entering
• Confirm breakouts and avoid traps
• Anticipate trend changes with more confidence
• Make smarter, data-backed investment decisions
“Price tells you what. Volume tells you who.”
Related Blogs:
Stock Market Investment: Top 4 Equity Investment Tips for “Beginners”
RSI (Relative Strength Index): How to Spot Reversals in Nifty Stocks
MACD Explained with Indian Stocks: Catching Momentum Before It Peaks
Disclaimer: This blog post is intended for informational purposes only and should not be considered financial advice. The financial data presented is subject to change over time, and the securities mentioned are examples only and do not constitute investment recommendations. Always conduct thorough research and consult with a qualified financial advisor before making any investment decisions.
