

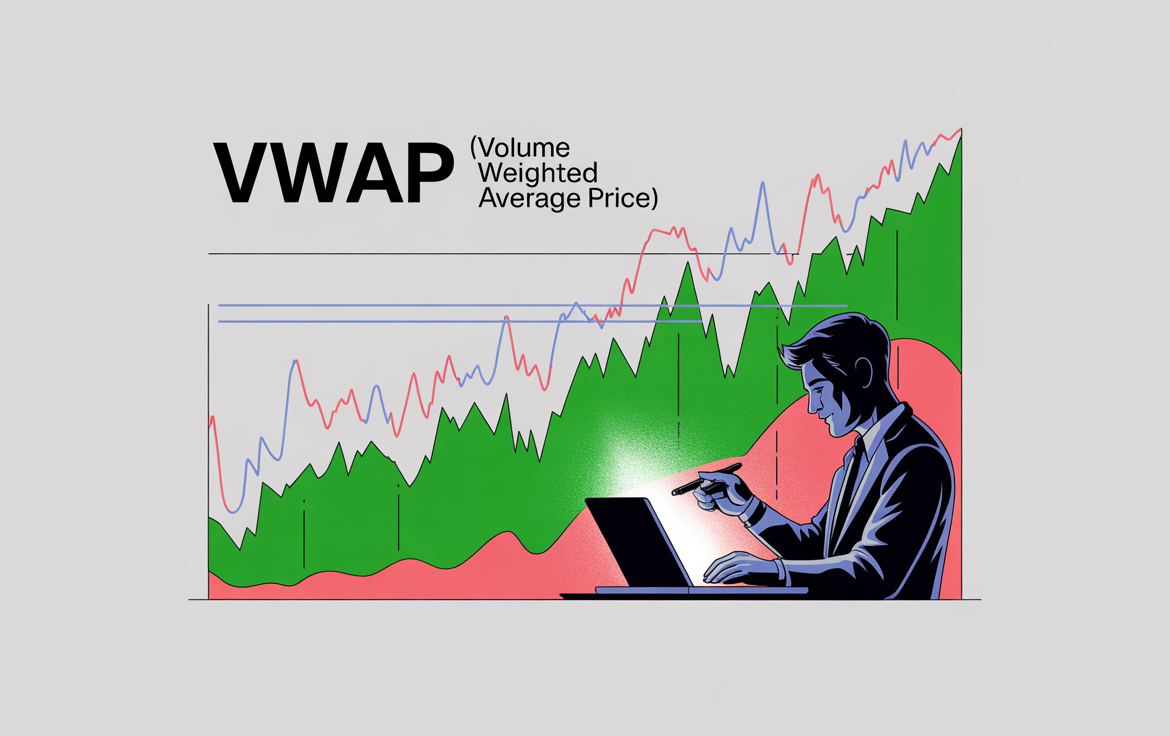
VWAP (Volume Weighted Average Price): A Pro Tool for Intraday Traders
VWAP (Volume Weighted Average Price): A Pro Tool for Intraday Traders
Ever wondered how institutions seem to time their intraday trades to perfection? One of their not-so-secret but highly effective tools is VWAP.
Thank you for reading this post, don't forget to subscribe!The Volume Weighted Average Price (VWAP) combines both price and volume to reflect the true average value of a stock over a trading session. Unlike simple price indicators, VWAP adjusts for volume shifts—making it a go-to tool in technical analysis for day traders across Indian markets, from Nifty 50 to heavyweights like Reliance, Infosys, and HDFC Bank.
Let’s break down how VWAP works, when to use it, and how it can upgrade your intraday investment decisions.
What Is VWAP?
VWAP stands for Volume Weighted Average Price. It shows the average price at which a stock has traded throughout the day, factoring in both volume and price. The heavier the volume at a particular price, the more influence it has on the VWAP.
Formula:
VWAP = (Sum of Price × Volume) / Total Volume
VWAP resets daily, making it ideal for intraday strategies—not for swing trading or long-term investment portfolios.
Why VWAP Matters in Trading
VWAP is widely used by institutions to evaluate trade execution and by retail traders to judge market sentiment.
✅ Confirms intraday trend direction
✅ Acts as real-time support or resistance
✅ Helps separate institutional moves from retail noise
✅ Enables risk-defined entries with better technical analysis structure
✅ Highlights reversal and breakout zones with volume context
How to Use VWAP in Intraday Trades
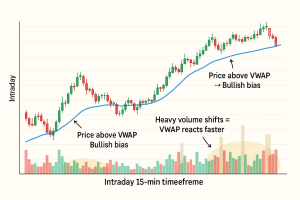
1️⃣ Trend Confirmation
- Price above VWAP = Bullish sentiment
- Price below VWAP = Bearish sentiment
Use VWAP as a bias filter—only go long if price is above VWAP, and short if below.
2️⃣ VWAP as Dynamic Support/Resistance
In trending markets:
- VWAP acts as support in uptrends
- Acts as resistance in downtrends
📌 Example:
In Nifty Futures, a pullback to VWAP followed by a bounce often signals institutional buying—ideal zone for low-risk entries.
3️⃣ VWAP Pullback Strategy
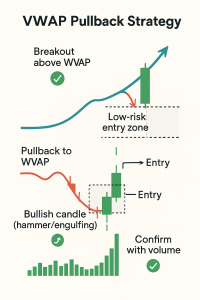
- Wait for a breakout above VWAP
- Enter on a pullback to VWAP + bullish candle pattern (e.g., hammer, bullish engulfing)
- Exit on previous high or 2:1 risk-reward ratio
This setup works well on high-beta F&O stocks like ICICI Bank or HDFC Ltd.
4️⃣ Rejection from VWAP
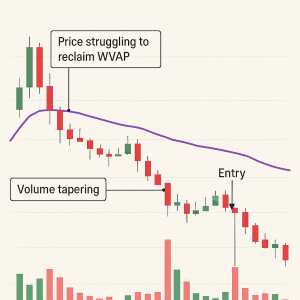
- Price fails to reclaim VWAP from below = Bearish rejection
- Look for short entries with SL just above VWAP
Often works on volatile counters like Zomato, Adani Ports, or Tata Motors.
Pro Tips to Maximize VWAP
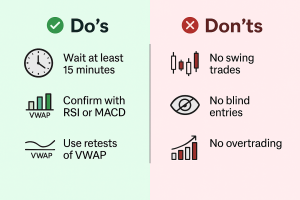
🔹 Always combine with candlestick confirmation
🔹 Use RSI or MACD for added technical analysis depth
🔹 Watch for VWAP break + volume spike → High conviction move
🔹 Avoid trades in the first 15 mins—volume is noisy
Real Market Examples (India)
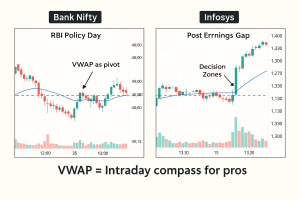
✅ Bank Nifty
During volatile events (like RBI policy days), VWAP acts as a pivot level, guiding high-confidence entries.
✅ Infosys (Post-Earnings)
Gaps after results? VWAP helps determine if the move has volume-backed confirmation or is a fade candidate.
⚠️ Common VWAP Mistakes to Avoid
❌ Using VWAP for swing or long-term investment decisions
❌ Entering breakouts without a VWAP retest
❌ Ignoring volume context—VWAP is volume-weighted for a reason
❌ Blindly assuming VWAP will always act as support/resistance
Conclusion
VWAP isn’t just for institutions. It’s a technical analysis staple that can bring clarity, control, and confidence to your intraday strategy. Think of VWAP as your intraday compass—it won’t predict the market, but it will keep you aligned with the real momentum behind the move.
“Retail traders watch price. Pro traders watch VWAP.”
Related Blogs:
Stock Market Investment: Top 4 Equity Investment Tips for “Beginners”
RSI (Relative Strength Index): How to Spot Reversals in Nifty Stocks
MACD Explained with Indian Stocks: Catching Momentum Before It Peaks
Volume Analysis: How Smart Money Leaves Clues
Moving Averages (SMA vs EMA): Which One Works Best in Indian Markets?
Bollinger Bands: Volatility-Based Setups That Actually Work
Fibonacci Retracement in NSE: Do These Golden Ratios Hold?
ADX (Average Directional Index): How to Avoid Sideways Traps
Stochastic Oscillator vs RSI: Which One to Trust and When
Disclaimer: This blog post is intended for informational purposes only and should not be considered financial advice. The financial data presented is subject to change over time, and the securities mentioned are examples only and do not constitute investment recommendations. Always conduct thorough research and consult with a qualified financial advisor before making any investment decisions.