


What Is Fundamental Analysis? A Beginner’s Guide
What Is Fundamental Analysis? A Beginner’s Guide
Before you invest in any stock, ask yourself:
👉 “Is this business worth owning?”
That’s the essence of fundamental analysis (FA)—evaluating a company’s true worth based on financials, business model, and future potential. Unlike technical analysis, which focuses on price charts, FA zooms in on the intrinsic value of a company.
In this guide, we’ll break down fundamental analysis with Indian stock examples so you can make smarter, long-term investment decisions.
What Is Fundamental Analysis?
Fundamental analysis is the process of evaluating a company’s financial health, management, competitive position, and economic environment to estimate its intrinsic value.
- If a stock is trading below its intrinsic value, it could be a potential buy.
- If it trades above intrinsic value, it could be a sell or avoid.
Why Use Fundamental Analysis?
Here’s why fundamental analysis is essential for investors:
✅ Identify Undervalued Stocks: Find stocks that have potential for long-term growth at an attractive price.
✅ Avoid Overpriced or Weak Companies: Protect yourself from potential losses by avoiding stocks with poor fundamentals.
✅ Invest Based on Facts: Make informed investment decisions backed by data, not hype.
✅ Navigate Market Volatility: Hold onto quality investments even during market downturns.
Key Elements of Fundamental Analysis
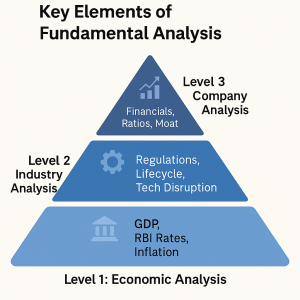
Let’s break it down into three key levels:
1️⃣ Economic Analysis (Macro View)
Start with understanding the overall economic environment:
- GDP Growth
- Interest Rates (RBI policy)
- Inflation & Fiscal Deficit
- Global Trends Impacting India
📌 Example: Rising interest rates could reduce credit growth for banks and NBFCs.
2️⃣ Industry Analysis
Now, assess the sector/industry dynamics:
- Demand-Supply Situation
- Regulatory Landscape
- Technology Disruption
- Industry Lifecycle Stage (emerging, growing, mature, or declining)
📌 Example: The EV boom impacts traditional automobile companies differently than electric vehicle and battery manufacturers.
3️⃣ Company-Specific Analysis
This is the core of fundamental analysis. Focus on these crucial areas:
- Study Financial Statements
- Profit & Loss Statement: Revenue, Net Profit, Margins
- Balance Sheet: Assets, Liabilities, Equity
- Cash Flow Statement: Operating, Investing, Financing flows
📌 Example: Look for companies with rising revenue, stable margins, and low debt.
Real-Life Example: HDFC Bank (FY24)
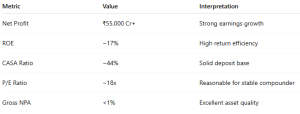
✅ Conclusion: HDFC Bank ticks most boxes for a fundamentally strong investment.
How to Do Fundamental Analysis (Step-by-Step)
Choose a Company You Understand
Start with well-known brands like HUL, Titan, or Asian Paints—companies you use or follow.
Study the Business Model
What does the company sell? Is its business scalable? Does it have a strong competitive edge (moat)?
Download Annual Reports
Visit the Investor Relations section of the company’s website for detailed reports.
Analyze 5-Year Financials
Look for consistent revenue and profit growth, low debt, and healthy margins.
Compare with Peers
Benchmark the company against others in the same industry to assess its relative position.
❗ Common Mistakes to Avoid
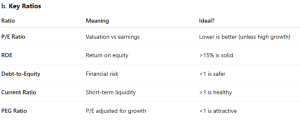
❌ Chasing Low P/E Stocks without checking for quality.
❌ Ignoring Debt Levels and cash flow dynamics.
❌ Relying on Tips from YouTube or TV analysts.
❌ Failing to Update Analysis Regularly to keep up with market changes.
Fundamental vs Technical Analysis
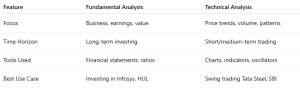
Many experienced investors combine both for entry timing and strong conviction in long-term investments.
Conclusion
Fundamental analysis empowers you to invest like a business owner—focused on long-term wealth creation, not just short-term speculation. It’s about picking quality companies with strong growth potential and holding them for the long haul.
“Price is what you pay. Value is what you get.” — Warren Buffett
Related Blogs:
Stock Market Investment: Top 4 Equity Investment Tips for “Beginners”
RSI (Relative Strength Index): How to Spot Reversals in Nifty Stocks
MACD Explained with Indian Stocks: Catching Momentum Before It Peaks
Volume Analysis: How Smart Money Leaves Clues
Moving Averages (SMA vs EMA): Which One Works Best in Indian Markets?
Bollinger Bands: Volatility-Based Setups That Actually Work
Fibonacci Retracement in NSE: Do These Golden Ratios Hold?
ADX (Average Directional Index): How to Avoid Sideways Traps
Stochastic Oscillator vs RSI: Which One to Trust and When
Ichimoku Cloud: Can This Japanese Indicator Predict Indian Market Trends? – Goodwill’s Blog
Best Indicator Combinations for Swing Traders in India – Goodwill’s Blog
Top 5 Indicator Setups for Bank Nifty Traders
Why Indicators Fail in Range-Bound Markets (and What to Do)
Disclaimer: This blog post is intended for informational purposes only and should not be considered financial advice. The financial data presented is subject to change over time, and the securities mentioned are examples only and do not constitute investment recommendations. Always conduct thorough research and consult with a qualified financial advisor before making any investment decisions.