Why Indicators Fail in Range-Bound Markets (and What to Do Instead)
Why Indicators Fail in Range-Bound Markets (and What to Do Instead)
Most technical indicators shine in trending markets—not when the market is stuck, silent, and moving sideways.
Thank you for reading this post, don't forget to subscribe!Welcome to the range-bound phase—a trader’s nightmare where good setups go bad, and most signals turn into expensive whipsaws.
In this guide, we’ll uncover:
- Why popular indicators like RSI, MACD, and moving averages fail in ranges
- How to identify sideways markets early
- What smart traders do to survive and profit during these choppy conditions.
What Is a Range-Bound Market?

A range-bound market is when price moves between clearly defined support and resistance levels, without a decisive breakout in either direction.
🔁 Key Characteristics:
- Low volatility and flat volume
- Price oscillates in a tight zone (e.g., Nifty stuck between 22,000–22,500)
- Frequent false breakouts and stop-loss triggers
- Conflicting or repetitive signals from indicators
Why Most Indicators Fail in Ranges
Most technical indicators are trend-following or momentum-based. In a sideways market, that logic breaks down.
⚠️ Common Failures:
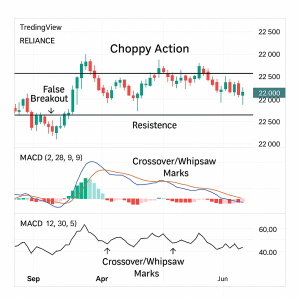
MACD Creates Whipsaws
- Constant crossovers without real price movement
- Leads to false entries and frequent stop-outs
Example: 4 MACD signals in 7 days on Bank Nifty—all fake breakouts.
RSI Gets Trapped Between 40–60
- No clear overbought or oversold signals
- Momentum remains unclear or misleading
Example: RSI flashes “Buy” at 45, but the price never moves.
Moving Averages Flatten Out
- Price keeps cutting short EMAs (20/50) both ways
- No real trend direction = messy signals
Example: SMA crossovers occur, but price moves only ₹10–₹20.
How to Detect a Range Early

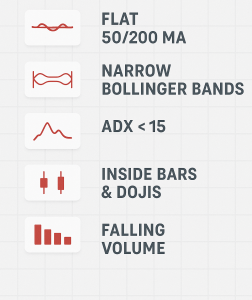
Spotting a range early is half the battle. Watch for these technical clues:
✅ Flat Moving Averages (especially 50/200 DMA)
✅ Narrow Bollinger Bands → Indicates low volatility
✅ ADX < 15 → Weak trend strength
✅ Price Candles: Inside bars, dojis, small-bodied candles
✅ Volume Drops → Lack of institutional participation
🧠 What Smart Traders Do in Sideways Markets
Successful traders adapt their tools and tactics when the market goes flat.
Use Oscillators at Extremes (Only at the Edges)
- RSI < 30 near support → Long Setup
- RSI > 70 near resistance → Short Setup
- Confirm with candlesticks: pin bars, engulfing, or double tops/bottoms
📌 Pro Tip: Avoid mid-range signals—edge trades offer the best RR.
Mark Key Support & Resistance Zones
- Manually draw horizontal zones where price has reversed multiple times
- Only trade when price is near the range boundaries
📌 Why it works: Tight stop, wider target = Better Risk-Reward
Turn Off Trend Indicators
- Avoid using tools like MACD, Supertrend, or crossover-based systems
- Use price action + volume instead
- Especially useful when price is inside the Central Pivot Range (CPR)
Scalp Small Moves With Tight Stops
- Ideal for intraday traders with quick execution
- Use tools like VWAP, 5-min support/resistance zones, and volume spikes
- Focus on 1:1.5–1:2 RR setups
📌 Only trade when volume confirms moves near edges.
⚠️ Mindset Shift: “No Trade Is a Good Trade”

Overtrading in a choppy market destroys capital and confidence.
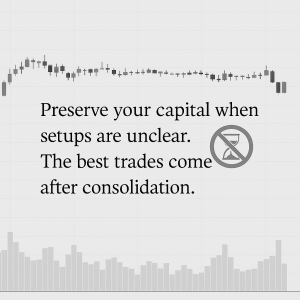
“Preserve your capital when setups are unclear. The best trades come after consolidation.”
Conclusion
Indicators don’t fail—you just have to know when they’re appropriate.
In range-bound markets:
- Recognize the sideways phase early
- Stop using trend/momentum tools blindly
- Switch to oscillators + price action
- Trade edges, or sit out until volatility returns
🧠 “Adaptability is your real edge. Tools are neutral—it’s how you use them that matters.”
Related Blogs:
Stock Market Investment: Top 4 Equity Investment Tips for “Beginners”
RSI (Relative Strength Index): How to Spot Reversals in Nifty Stocks
MACD Explained with Indian Stocks: Catching Momentum Before It Peaks
Volume Analysis: How Smart Money Leaves Clues
Moving Averages (SMA vs EMA): Which One Works Best in Indian Markets?
Bollinger Bands: Volatility-Based Setups That Actually Work
Fibonacci Retracement in NSE: Do These Golden Ratios Hold?
ADX (Average Directional Index): How to Avoid Sideways Traps
Stochastic Oscillator vs RSI: Which One to Trust and When
Ichimoku Cloud: Can This Japanese Indicator Predict Indian Market Trends? – Goodwill’s Blog
Best Indicator Combinations for Swing Traders in India – Goodwill’s Blog
Top 5 Indicator Setups for Bank Nifty Traders
Disclaimer: This blog post is intended for informational purposes only and should not be considered financial advice. The financial data presented is subject to change over time, and the securities mentioned are examples only and do not constitute investment recommendations. Always conduct thorough research and consult with a qualified financial advisor before making any investment decisions.


